How Computer Vision Based Heat Mapping is Helping Retail

Table of Contents
- Introduction
- Understanding Computer Vision-Based Heat Mapping
- Applications
- Frequently Asked Questions
Introduction
In today's rapidly evolving retail landscape, understanding customer behavior has become paramount for businesses striving to stay competitive. One innovative technology at the forefront of this endeavor is computer vision-based heat mapping.
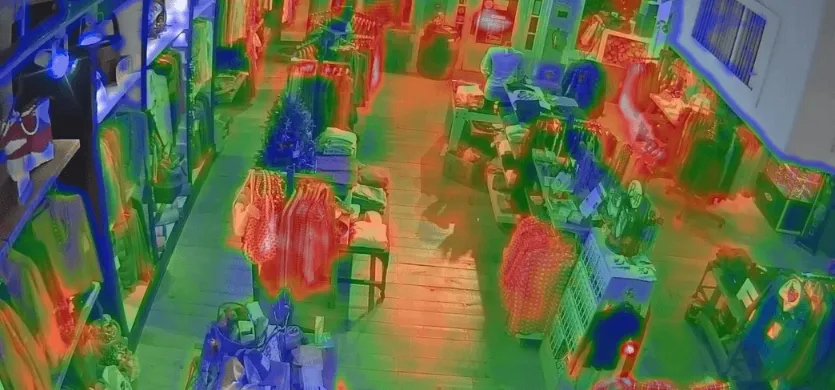
Heat mapping is a technique that provides a visual representation of data by assigning colors to different levels of activity or “heat”.
In this blog, we'll delve deeper into the applications and benefits of computer vision-based heat mapping in revolutionizing the way retailers understand and engage with their customers.
Understanding Computer Vision-Based Heat Mapping
Computer vision is a branch of artificial intelligence that enables computers to interpret and understand visual information from the real world, much like humans do with their eyes.
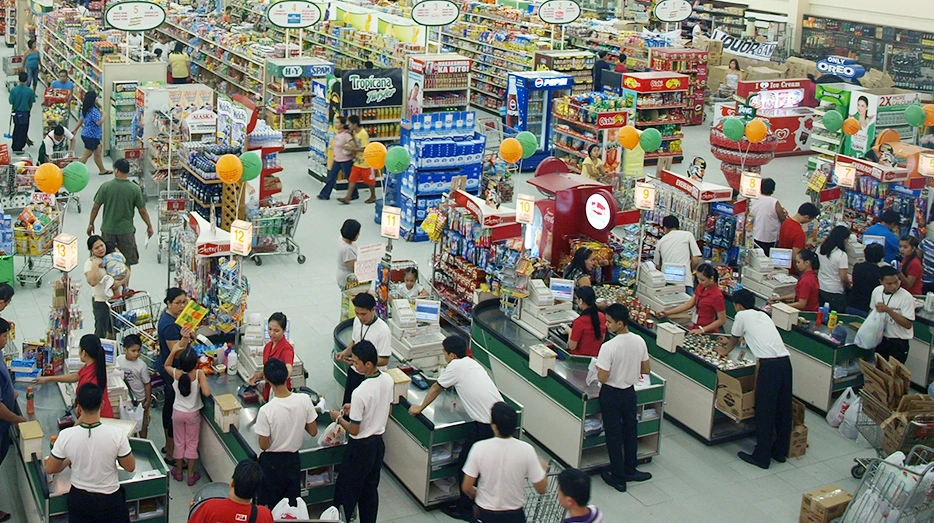
In the context of retail, computer vision technology utilizes cameras and sensors to capture and analyze visual data within a store environment.
The technology behind such systems typically involves a combination of hardware and software components. Cameras strategically placed throughout the store capture video footage of customer movements and interactions.
Advanced algorithms then process this visual data in real-time, identifying and tracking individuals, objects, and spatial patterns. The resulting data is then translated into heat maps, graphs, and other visualizations, providing retailers with actionable insights into customer behavior.

Applications
Overview of the Applications:
- Inventory Management
- Foot Traffic Analysis
- Customer Engagement
Inventory Management
In traditional inventory management, employees manually count and record inventory levels, often leading to errors and inefficiencies. Barcode systems require scanning each item individually, which can be time-consuming and prone to errors.
Computer vision enhances inventory management by automating the process of tracking and monitoring inventory levels. Cameras and sensors are installed in warehouses or stores to capture images of shelves and products.
Additionally, heatmap analysis visualizes inventory hotspots, identifying high-traffic areas for stock placement optimization. This integration enhances inventory accuracy, reduces labor costs, and optimizes supply chain operations efficiently.
YOLO and Faster R-CNN enable real-time object detection and tracking, ensuring accurate inventory counts and reducing the risk of stockouts.
Foot Traffic Analysis
Foot traffic analysis involves tracking and analyzing the movement of people within physical spaces, such as retail stores, malls, or public areas
Previously, the store relied on manual observations or basic counters at entrances to estimate foot traffic. This method provided limited insights and did not capture detailed customer movement patterns.
The foot traffic analysis reveals that certain aisles receive higher customer traffic than others, while some areas are underutilized. Based on these insights, the store reconfigure its layout, placing popular products and promotions in high-traffic areas to increase visibility and sales.
Additionally, they adjust aisle widths and display heights to improve navigation and enhance the overall shopping experience.
Customer Engagement
By analyzing heat map data, the retailer can determine whether the display attracts customers' attention and influences their purchasing decisions.
Additionally, heat mapping can reveal how customers interact with interactive elements such as touch screens or digital kiosks, providing insights into their preferences and behaviors.

In conclusion, while computer vision-based heat mapping presents challenges, its integration with emerging trends like AI-driven analytics promises transformative possibilities for the future of retail.
Frequently Asked Questions
What is heat mapping in retail?
Heat mapping in retail uses color-coded visualizations to represent customer behavior and product interactions within stores. It helps retailers understand which areas attract more attention, allowing them to optimize store layouts, product placements, and promotional strategies for better sales performance.
What is heatmap in data analytics?
A heatmap in data analytics is a graphical representation that uses color gradients to visualize data patterns or relationships. It helps analysts identify trends, outliers, and correlations in large datasets, making complex data more accessible and facilitating data-driven decision-making across various industries and domains.
What is a heatmap in sales?
A heatmap in sales displays areas of sales activity or performance intensity using color gradients. It helps sales teams identify hotspots of customer engagement, high-performing regions, and potential sales opportunities. By visualizing sales data geographically, companies can focus resources and strategies to maximize revenue and market penetration.
What is heat map analysis in stock market?
Heat map analysis in the stock market visualizes market performance by representing price movements of stocks or indices using color gradients. It helps investors quickly identify trends, market sentiment, and areas of strength or weakness within the market, guiding investment decisions and portfolio management strategies effectively.

Simplify Your Data Annotation Workflow With Proven Strategies
.png)


